
General Remarks
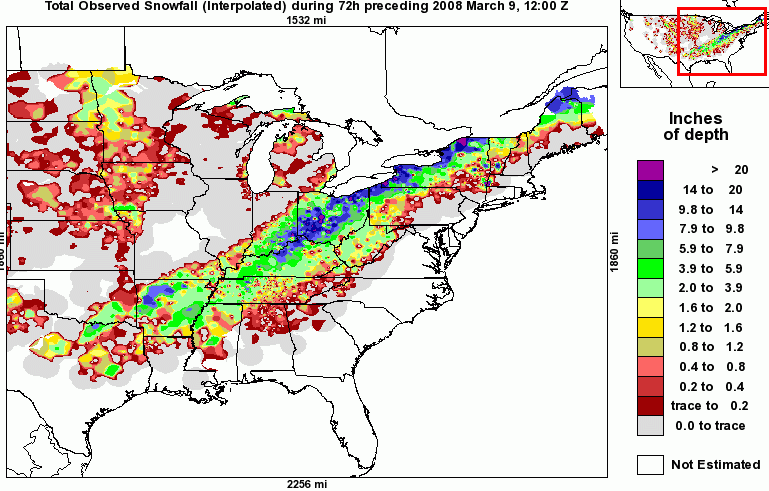
This was a significant late-winter snowstorm bringing snow from New Mexico and northern Texas through the Ohio Valley to far northern New England. The Ohio Valley was particularly hard hit.
Surface Charts
Loop of GFS sea level pressure and thickness
Loop of NCEP Surface Charts
Loop of UCAR mesoscale surface map
Loop of RUC Surface Temperature
Loop of Radar
15 UTC March 6th
weak low in southern Texas with a cold front/stationary front across the Ohio Valley and Great Lakes. At this time light to moderate
snow was falling across the Texas Panhandle and Oklahoma with some rainfall was occurring in Texas
03 UTC March 7th
Infusion of colder arctic air into the upper Midwest while a low was developing on the cold front in Louisisana. At this time, moderate rain and snow were occurring in Arkansas, and convective rainfall was happening near and behind the cold front in Louisiana. Also convective rainfall was occurring in New Orleans and the Gulf of Mexico, and in central Florida.
12 UTC March 7th
A low pressure center consolidated at the intersection of the cold front and two stationary fronts in the Panhandle of Florida and central Georgia, of about 1003mb in magnitude. The arctic high pressure in Minnesota intensified slightly to an impressive 1037mb. Tropical air was beginning to erode the wedge airmass in Georgia and South Carolina. Heavy convective rains were inundating Georgia, the Panhandle of Florida, eastern Tennessee, and Kentucky. Light snow occurred from near Louisville all the way to near Dallas.
15 UTC to 18 UTC March 7th
Light snow became more steady in much of the Ohio Valley and across northeast Ohio, while convective rainfall moved on to the Carolinas and Virginia.
850mb charts
Loop of 850mb
700mb and 500mb charts
Loop of 700mb
Loop of 500mb
00 UTC March 7th
A vorticity maximum associated with the storm of interest is over northwest Texas and western Texas. There is nearly a straight northerly flow from Saskatchewan to western Nebraska, helping to drive a vorticity maximum in North Dakota southward.
12 UTC March 7th
Vorticity maximum in eastern Texas is driving the main low pressure to intensify. There is a digging vorticity maximum in Nebraska. There was a confluent zone in Illinois and a strong southwesterly flow east of the Mississippi River.
00 UTC March 8th
Vorticity maximum in Kansas starts to merge with the upper low in Arkansas.
06 UTC March 8th
There is a diffluent flow in the Ohio Valley and Tennessee, along with a confluent flow north of it, in southern Ontario. The main upper low is centered near Memphis.
12 UTC March 8th
The 500mb low finally closes off between Louisville and Nashville. It appears the storm is kicked somewhat by a new vorticity maximum moving into North Dakota.
00 UTC March 9th
The upper low center moves much more quickly to near Buffalo.
Jet stream level charts
Loop of 250mb
Loop of 300mb
Infrared satellite loop
Loop of IR Satellite Images
Loop of Water Vapor Satellite Images
The purpose is to provide high quality information on historical storms
and provide links to weather information.